This benchmark have three pool configurations: Single drive, a 2-way mirror, and a 3-way mirror. Please see the previous posts on testing methology and hardware specifications, if you haven’t already.
I expect the single drive to have the best write performance, followed by the 2-way then 3-way mirror. I also expect the mirrors to have better read performance, as there’s more drives to read from. I also expect there to be a noticeable performance penalty for record sizes smaller than ZFS’s configured recordsize of 128k. I expect error margins of +/- 10%. The random reads/writes should get almost linearly better performance with the larger record sizes.
Without further ado, here are the results!
Write
 Overall, this graph makes no sense. Why is the 2-way mirror performing much better than the single drive and 3-way mirror in almost half of the tested record sizes? Why is there nearly no penalty on 64k record sizes for the 3-way mirror?
Rewrite
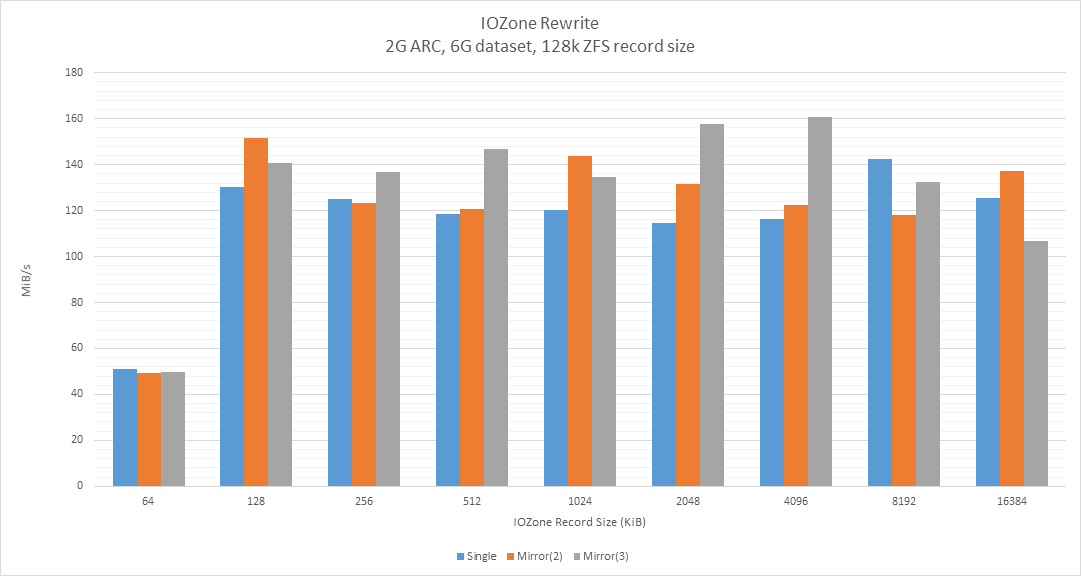 This graph makes a little more sense, as the 64k record size has a significant performance penalty compared to the native 128k record size. I still have no idea how the 2- and 3-way mirrors can have better performance than the single drive, though; unless the error margins are much larger than predicted.
Read
 Finally, a graph which performs almost exactly as expected. The boost in read performance between single drive and 2-way mirror is slightly less than expected, and the boost from 2-way mirror to 3-way mirror is almost uncanny: It goes from ~200MiB/s to ~300 MiB/s, or a 50% increase. This means the 2- and 3-way mirrors scale linearly when compared to each other, but not when compared to the single drive. This may be explained by the logic involved in handling a mirror. If anyone knows, please leave a comment!
Do note that the performance of 64k reads are almost identical to that of 128k reads. This is most likely because ZFS reads the whole 128k record off disk, and remembers it long enough for the next read to benefit from it.
There is also a dip at 1024k, which may need re-testing to figure out whether it is random.
ReRead
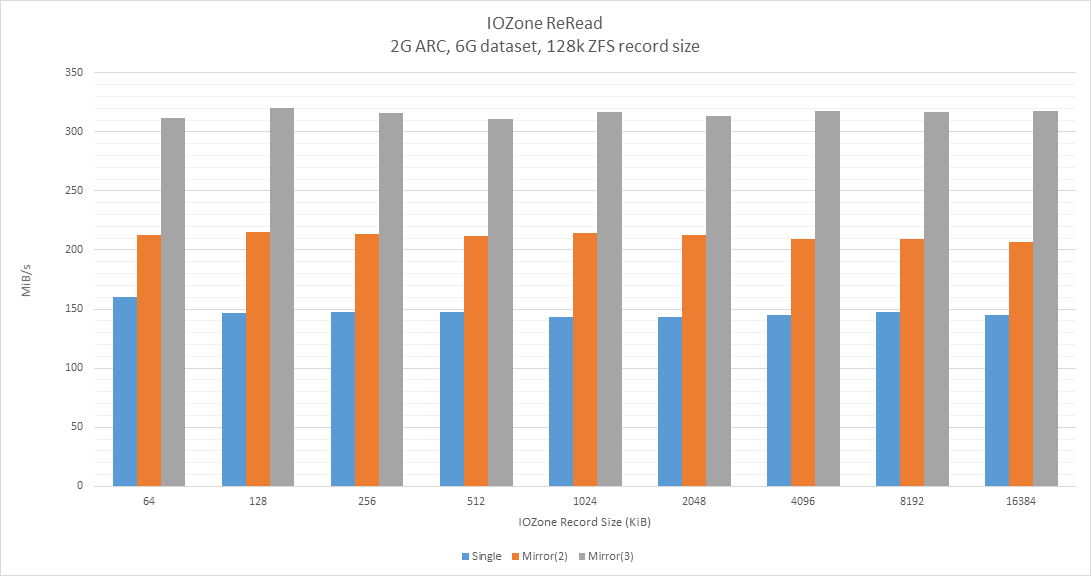
This graph makes for the same observations as the Read graph, except there’s not a dip, but rather a slight spike at 1024k.
Random Read

This graph behaves roughly as expected. 64k hovers around 10MiB/s, with a slight advantage to the single drive. I’m not sure why the mirrors perform slightly worse here; it may be within error margins, or there may be something related to the overhead of handling mirrors. 128k hovers around 20MiB/s, and all three candidates are at roughly the same speed. At 256KiB/s, the two mirrors are performing virtually identically to eachother, but slightly better than the single drive; this makes sense, as we’re now at twice the amount of data stored in a single zfs record.
The mirrors scale as expected with the bigger read operations.
Random Write
 I had expected the 64 KiB record size to suffer some penalty, maybe half the performance of the 128k record size. However, the actual performance is about 18 times less. Other than that, there’s still the same weird performance ‘bumps’ as seen in sequental write & rewrite.
Backwards Read

This test performs as expected. 64k performs bad because ZFS has to read 128k to serve 64k of data, 128k performs really well because zfs reads exactly what is required (assuming the reads were aligned), and 256k performs “bad” because it reads two zfs records (128k each), in reverse order.
“This test measures the performance of reading a file backwards […] Although many operating systems have special features that enable them to read a file forward more rapidly, there are very few operating systems that detect and enhance the performance of reading a file backwards.” – documentation
Stride Read


This test gives roughly expected results, with the exception of flatlines at 512k, 4096k and 8192k. There’s also a very noticeable spike at 1024k which I can’t explain.
FWrite

Please excuse the inaccurate chart title. FWrite refers to the fwrite() call performed by IOZone, which essentially means the writes are buffered.
64k writes are still much slower than expected, while the remaining data is somewhat surprising with the unpredictable performance of the 2- and 3-way mirrors.
FReWrite
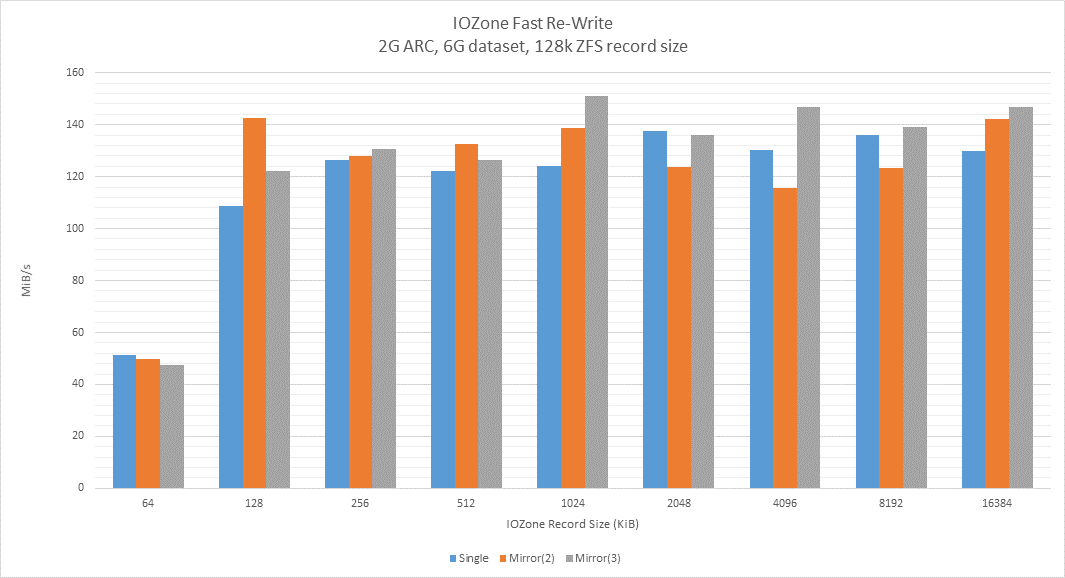
The performance of 64k writes are roughly what I expected. However, the remaining record sizes make little sense to me, as the 3-way mirror is writing faster than the single drive in many cases, considering that a mirror is theoretically as fast as its slowest disk, when writing. Although I do not see how, the caching nature of fwrite() may have something to do with it. Comments would be welcome!
FRead

The performance seen here, is very similar to the performance in the normal read tests shown earlier, with the exception of being slightly faster.
Quoting the documentation: “This test measures the performance of reading a file using the library function fread(). This is a library routine that performs buffered & blocked read operations. The buffer is within the user’s address space. If an application were to read in very small size transfers then the buffered & blocked I/O functionality of fread() can enhance the performance of the application by reducing the number of actual operating system calls and increasing the size of the transfers when operating system calls are made.”
FReRead
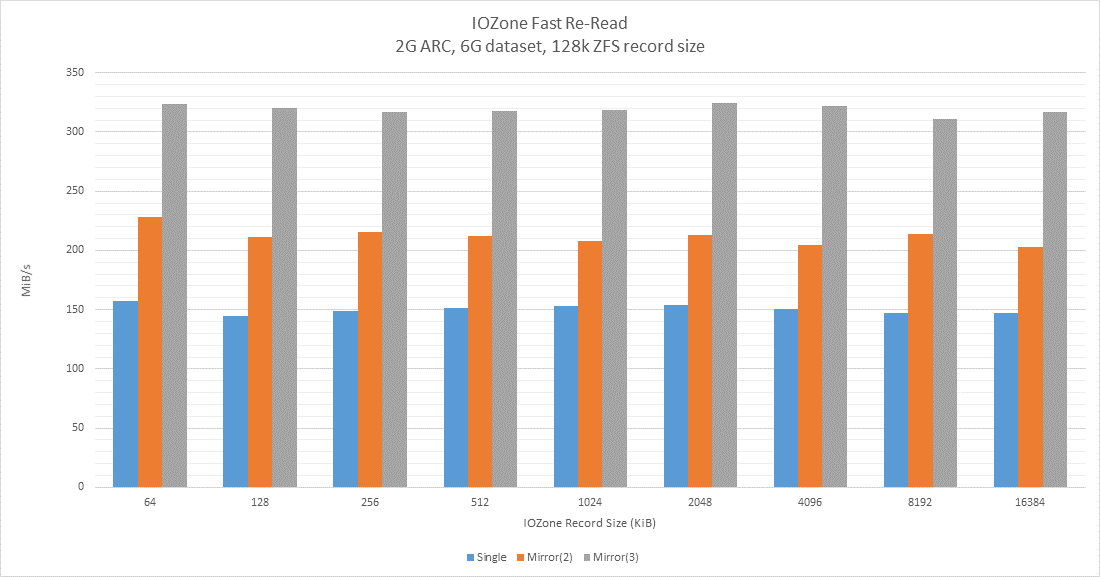
This performs similarly to FRead and normal reads shown earlier. Quoting the documentation: “This test is the same as fread above except that in this test the file that is being read was read in the recent past. This should result in higher performance as the operating system is likely to have the file data in cache.”
Since the dataset size is 6g, while the ARC (filesystem cache, if you will) is 2g, these results are as expected, because the relevant data would be flushed out of cache before it’s read again, in most cases.
In Conclusion
Seeing the results of the first write test, I was really concerned that my benchmarks had been skewed in some unknown way. However, since both sequental non-buffered write tests show the same behavior (random write test shows similar behavior, but occuring with different record sizes), it’s tempting to suggest something is amiss with how ZFS handles writes to mirrors and single drives. However, this will need further examination before any conclusion can be drawn.
I was really surprised at the terrible performance of writes smaller than the zfs record size. This warrants further study with different zfs record sizes, and other likely suspects.
The read performance was more or less as expected.

Any follow up on this?
LikeLike